
Digital PR8 min read
Data-Driven PR: How to Turn Your Data Into Press Coverage
Published · RankMonks
Data-driven PR is the practice of earning press coverage by giving journalists an original finding drawn from data. Instead of asking a reporter to write about your company, you hand them a fact their readers have not seen before, with the evidence behind it.
This guide covers where the data comes from, how to tell whether a finding is a story, the method for getting from a question to a pitch, how to make the numbers stand up, and how to package them so journalists can cite and link to them.
Key takeaways
- Journalists cover data because a new, checkable fact gives them a story, and they link to the source because their readers expect to see it.
- The strongest data is the kind only you hold, such as product usage, customer records and sales patterns.
- A finding is a story when it is new, relevant to the outlet's readers, simple enough to say in one sentence and at least a little surprising.
- Credibility comes from stating the method openly, including the sample, the dates and the limits of what the data shows.
- The findings need a home on your own site, with the headline number, the charts and a methodology note, so that coverage has something to link to.
What is data-driven PR and why do journalists use it?
Data-driven PR is a type of digital PR in which the story you offer is a finding from data. Journalists use it because a credible number turns a general topic into news, and because someone else has already done the work of producing it.
A reporter covering small business does not need another company saying that late payment is a problem. They can use a finding that shows how late the typical invoice is paid, split by sector, with a method they can check.
This is also why data earns links more reliably than most campaigns. When an article quotes a figure, readers and editors expect to see where it came from. The natural way to show that is a link to the page with the full results, which is the kind of link our guide to link building describes as worth having.
Where does the data for a PR story come from?
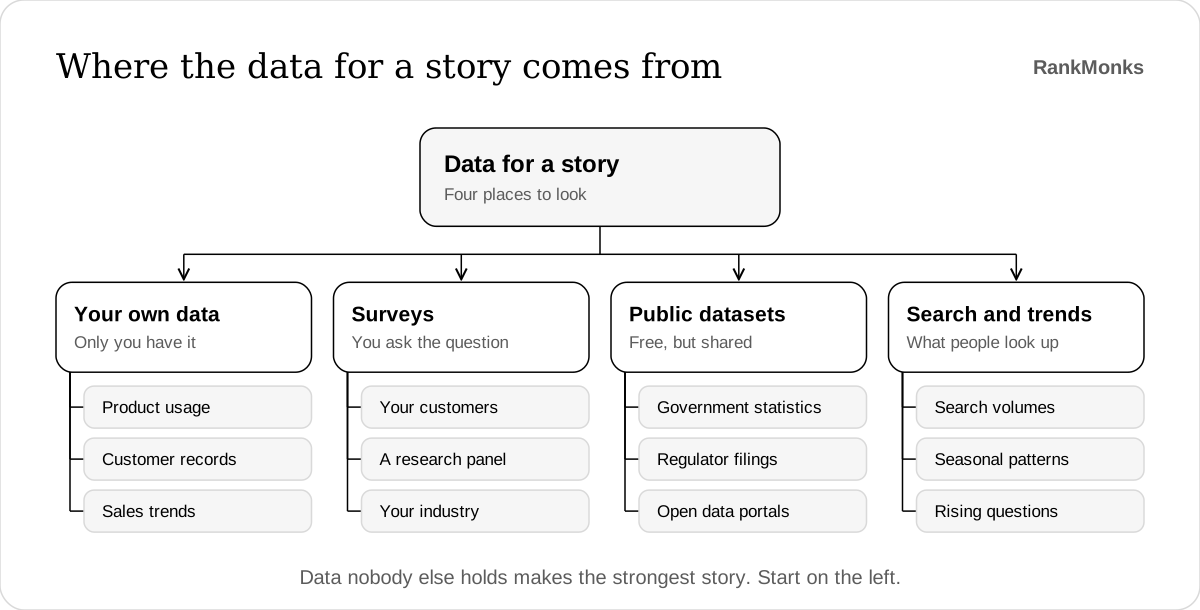
The data for a PR story comes from four places: your own records, surveys you commission, public datasets and search or trend data. They differ in cost, in speed and in how exclusive the result is.
| Source | Strength | Weakness | Best for |
|---|---|---|---|
| Your own data | Nobody else has it | Needs cleaning and privacy checks | Stories about behaviour in your market |
| Surveys | You choose the question | Costs money, and weak samples get challenged | Opinions and intentions |
| Public datasets | Free and trusted | Anyone can run the same analysis | Regional and national comparisons |
| Search and trend data | Fast and current | Shows interest, not behaviour | Seasonal and emerging topics |
Your own data is the place to start. A scheduling tool knows which day of the week meetings are most often cancelled. A recruitment platform knows how long roles stay open. Most companies hold something like this and have never looked at it as a story.
Surveys let you ask exactly what you want to know. Use a recognised research panel for the public, or survey your own customers and say clearly that you did.
Public datasets from governments, regulators and open data portals are free and widely trusted. The story is in the analysis: a comparison, a ranking or a trend nobody has drawn out yet.
Search and trend data shows what people are looking up and when. The same tools you use for keyword research can show a question rising sharply, which is often a story in itself.
What makes a finding a story?
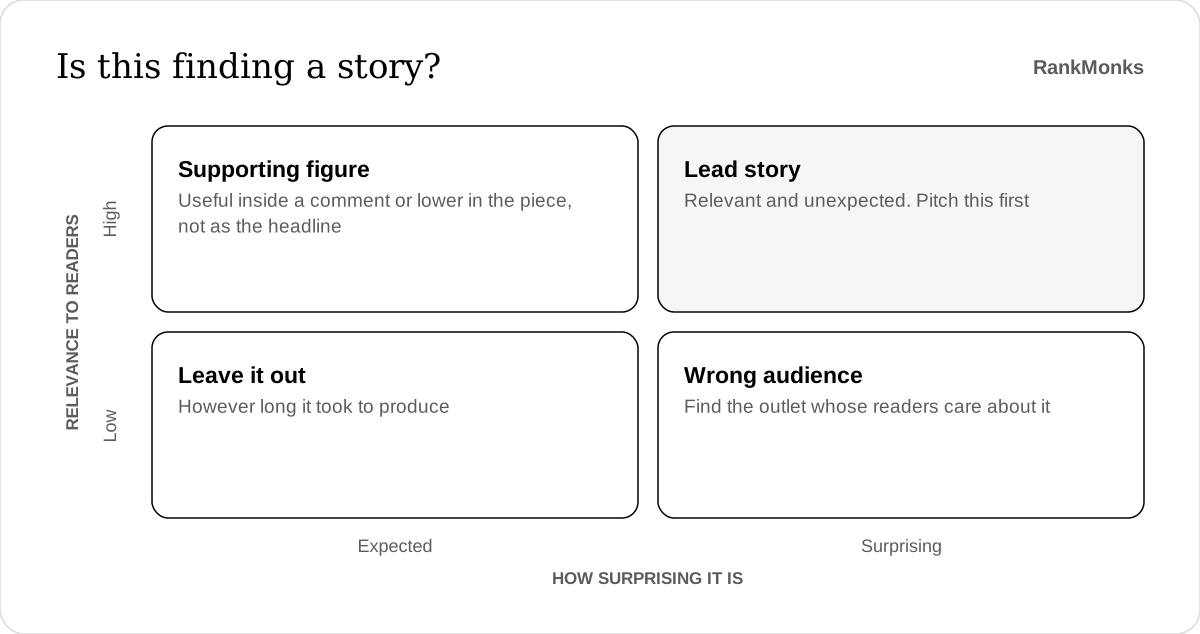
A finding is a story when it is new, relevant to the people who would read it, simple enough to state in one sentence and surprising enough to be worth repeating. Most datasets contain many true facts and only one or two that pass all four tests.
- New. Nobody has published it, or nobody has published it this year, for this region or for this group.
- Relevant. It affects the outlet's readers. A finding about warehouse staffing belongs in logistics titles, not consumer news.
- Simple. You can say it in one sentence with one number. If it needs three caveats before it makes sense, it is analysis, not a headline.
- Surprising. It contradicts an assumption, shows a gap larger than expected or reveals a difference between groups.
A finding that confirms what everyone believes can still be useful, as long as it is the first hard number on the subject.
Rank your findings before you pitch. Lead with the one that is both relevant and surprising, and keep the rest as supporting detail.
How do you turn data into a story, step by step?
You turn data into a story by working through six steps: question, data, analysis, headline finding, methodology and pitch. Starting with the question, instead of the data, is what keeps the result relevant.
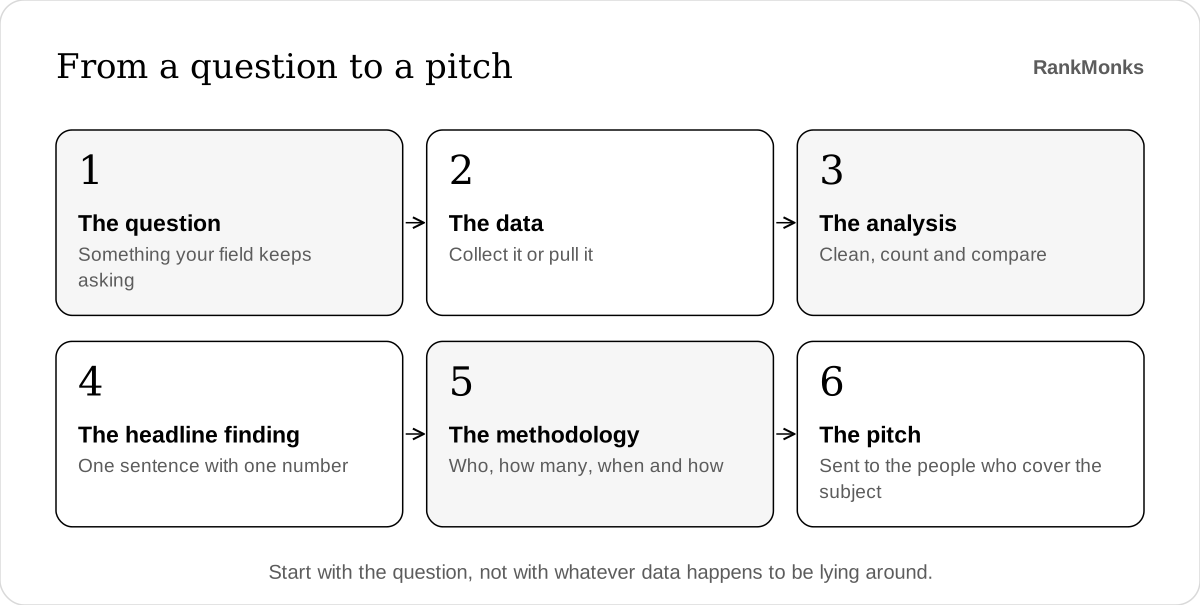
- Choose the question. Pick something your customers, your sales team or the trade press keep asking. A question people already care about has an audience waiting.
- Get the data. Pull it from your own systems, commission a survey or download a public dataset. Note the dates and the sample size as you go.
- Analyse it. Clean out duplicates and errors, then count, compare and split by group, region or time. Look for the gap or the change.
- Write the headline finding. One sentence with one number. Then list three or four supporting findings beneath it.
- Write the methodology. Say who or what was measured, how many, when, and how the figures were calculated.
- Pitch it. Send the headline finding to the journalists who cover the subject, with a link to the full results. Our guide on how to pitch journalists covers the email itself.
For example, a fleet management software company wants coverage in transport and business titles. Its question is one drivers and managers argue about: when are delivery vans most often delayed? It analyses a year of anonymised trip records, and finds that delays peak on one weekday afternoon in every region. That single finding becomes the headline. Regional tables give local reporters their own angle, and the operations director is offered for comment.
How do you make the data credible?
You make the data credible by being open about how it was produced, and by claiming no more than it shows. A journalist who cannot verify a number will not use it, and one who is embarrassed by it will not open your next email.
Check these before anything goes out:
- The sample is big enough to mean something. Give the number. If a regional split rests on a handful of responses, leave that split out.
- The method is stated in full. Who was asked or what was measured, the dates, how the data was collected and how each figure was calculated.
- The data is anonymised. No individual customer or person should be identifiable, and your use of the data must fit your privacy terms.
- The wording matches the evidence. Data from your customers describes your customers. Say "of the businesses using our platform", not "of all businesses".
- Correlation is not presented as cause. If two things move together, say that. Do not say one produces the other unless you can show it.
- The questions were neutral. A survey question that pushes people towards an answer undermines every figure that follows.
This openness is also good for search. A page with a named author, a clear method and original data shows the experience and trust that E-E-A-T describes.
How should you package the findings for journalists?
Package the findings as a single page on your own site that holds the headline finding, the key numbers, the charts and the methodology. This is the page journalists cite, and the page their links point to.
Build it in this order:
- The headline finding in the first sentence, in plain words.
- Three to five key findings as a short list, each one a complete sentence that can be quoted alone.
- Charts that each make one point, with a title that states the point. Offer them for reuse with credit.
- Tables for regional or sector splits, so local and trade reporters can find their own line.
- Expert comment from a named person, explaining what the finding means.
- The methodology at the bottom, in full.
- A contact for press questions, with a name.
Keep the page live and at the same address. Coverage arrives for months, and writers often find research through search long after the campaign ends. If you repeat the study each year, update the same page so the links it has earned keep working for you, the approach our guide to content decay recommends for any page that ages.
Clear statements of fact on this page are also what answer engines lift. Our guide to SEO in the AI era explains why passages that state a finding plainly are the ones models quote, and measuring digital PR shows how to track what the campaign did.
Frequently asked questions
How much data do you need for a PR story?
There is no fixed amount of data you need for a PR story, but the sample must be large enough that the finding would not change if a few records were removed. State the sample size openly and avoid splitting it into groups too small to support a claim. A modest dataset analysed honestly is more useful than a large one presented carelessly.
Can you run data-driven PR without your own data?
You can run data-driven PR without your own data by using public datasets, search trends or a commissioned survey. The trade-off is exclusivity, because anyone can analyse a public source. Add value through the question you ask, the comparison you draw or the expert who interprets the result.
How often should you publish data stories?
How often you publish data stories depends on how much sound data you have, and for most companies two to four a year is realistic. One well-made study that is repeated annually often earns more than several rushed ones. Journalists come to expect it, and each edition gives them a new comparison with the year before.
Do journalists link to the data?
Journalists often link to the data when it has a clear home, but no outlet is obliged to. Make linking easy by giving one address for the full results and mentioning it in the pitch. If an article cites the finding without a link, the mention still has value, and a polite request for a source link is reasonable.
Good data stories are found by asking a real question and reporting the answer honestly. That is the story-finding part of our digital PR work. If you think there is a story in your data, start a conversation.
Written by RankMonks.